


Last year, we wrote about SF’s VisionZero Plan — the city’s 2014 road safety policy and goal to have zero traffic deaths by 2024. I thought it’d be informative to check in and see how the projects are coming along, as well as see where the city is on traffic fatalities two years later.
Vision Zero plans have popped up in various cities internationally with the belief that city traffic accidents aren’t just “accidents” but incidents that could have been avoided through better road design and public education. VisionZero SF is a four-prong approach to reducing traffic fatalities: education, enforcement, engineering, and evaluation. The policy calls for 13 miles of road safety improvements in San Francisco, an enforcement campaign aimed at violations that are associated with high injury corridors (all the bicycle ticketing in the Wiggle?), and expanding training programs for drivers of large vehicles.
Here are all of the engineering projects that are part of the VisionZero plan. If you click on the map, you’ll be taken to the MTA’s interactive map. You can click on all the lines and dots to see what each project is, how much it’ll cost, and construction dates.
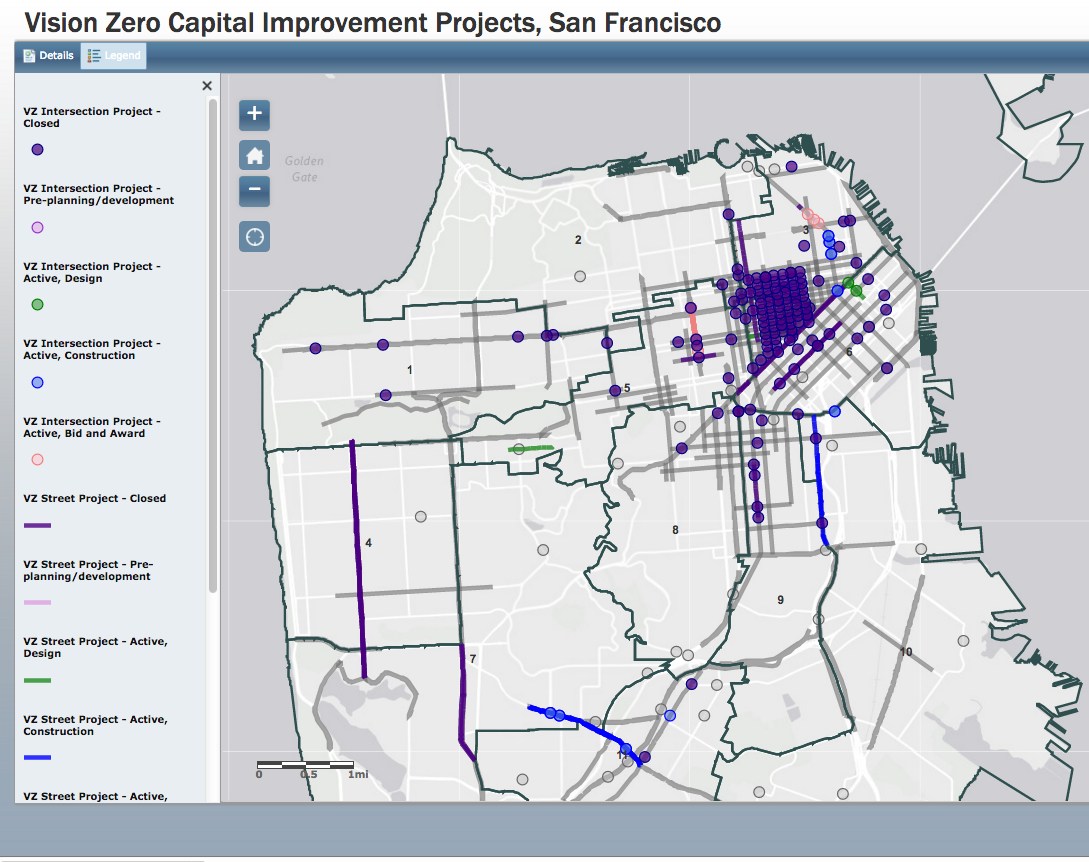
Dots are for intersections, lines are for roadways. The purple dots and lines are projects that have been completed. Lavender dots and lines are projects that are in the pre-planning/development stage. Green means projects that are in active design. In blue, are projects currently under construction. (Grey dots and lines are intersections and roadways in the “Vision Zero High Priority Network,” although it seems projects to address them aren’t yet to the pre-planning or development stage.)
(Last year, the city published a map detailing all pedestrian and bicyclist fatalities and accidents from 2004 to 2011. Comparing the maps, the Vision Zero street safety projects highly correspond to where pedestrian fatalities occur in SF: SOMA, Union Square, and the Tenderloin.)
Clearly, the city has done a lot of work on specific intersections already (all those purple dots). I have noticed a lot of these projects going in. Have you? None of them are near us, though, so I’d be interested to hear if any of you have noticed changes in your neighborhood — have streets felt safer? (Actually, we got a walk-signal (flashing yellow lights) near us that cars roundly ignore, but it’s not listed as a project here.)
But, there are only a few roadway projects so far (and while the VisionZero action plan includes Muni Forward initiatives, they don’t seem to be reflected in this map just yet — all those red lanes drivers are complaining about). I’d go ahead and guess those projects are much more expensive than the signal replacement/installation projects that make up a lot of the purple dots. The blue line on Potrero Avenue is a $12 million streetscape project, with widening sidewalks and new bike lanes. (Signal replacement/installation is more in the $20,000 to $350,000 realm.)
It’s kind of a fun map to poke around on.
The SFPD is also publishing monthly stats on traffic citations, which is also kind of fascinating. Here is March 2016 compared to March 2015.
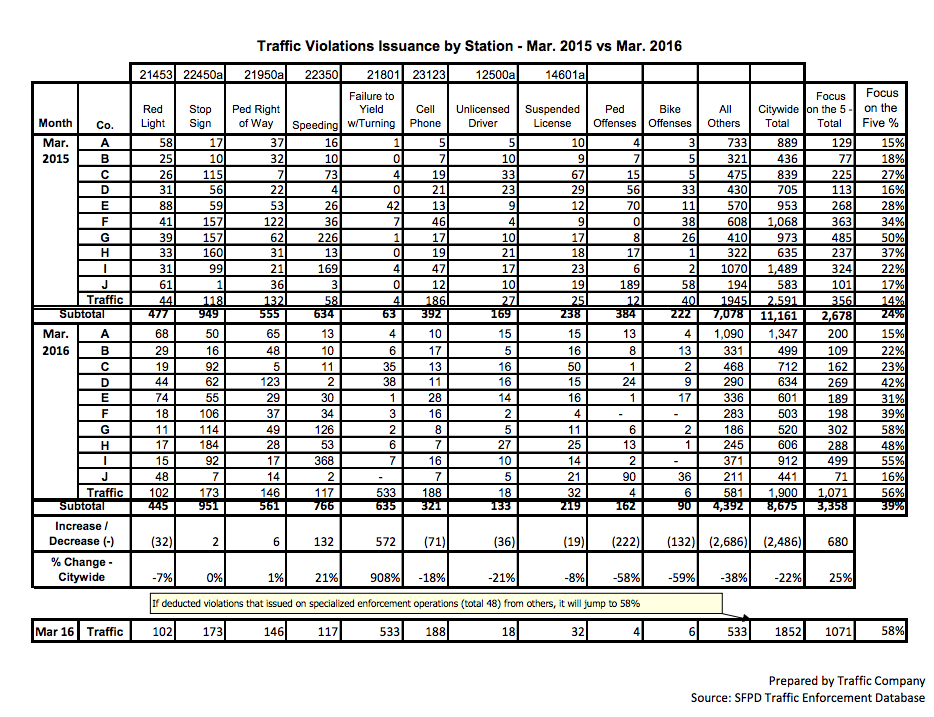
I wouldn’t say these numbers are dramatically improved, if we’re taking increased enforcement as a mark of improvement. March 2016 had just 2 additional enforcement actions against people driving through stop signs, for instance. I…am sure a lot more people are doing that. The number of red light violation citations has actually decreased by 32. Although, it seems the SFPD is cracking down on failing to yield while turning — the city has issued 908% more citations for that this year than last. And there has been a 21% increase in speeding citations. But, overall, the city has issued 22% fewer traffic citations over the year prior, which again seems like movement in the wrong direction if enforcement is supposed to be increasing as a part of Vision Zero. On the flip side, it looks like the city’s pedestrian and bicyclist ticketing is going down — if you remember, there was a bit of a to-do last year when bicyclists started getting citations.
In a useful bit of accountability, the MTA has also been publishing monthly traffic fatality reports since 2014. Let’s see how we’re doing!
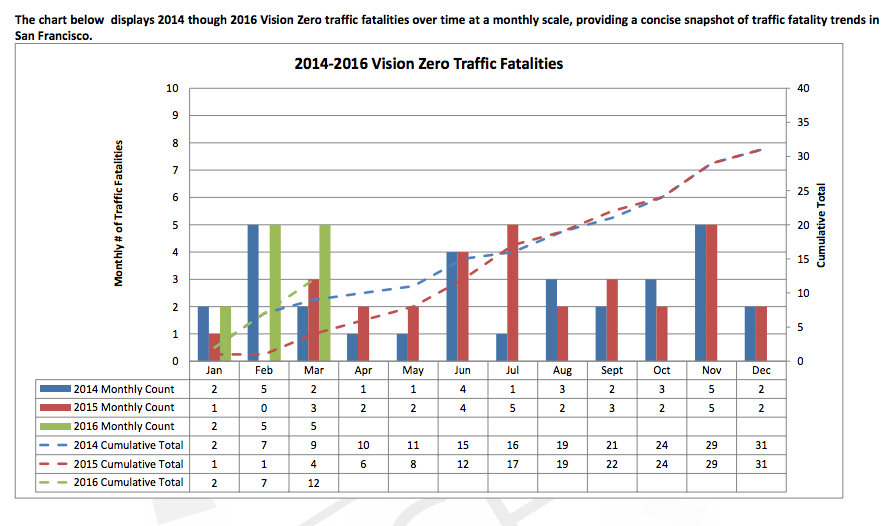
Despite the VisionZero kick-off in 2014, the number of traffic fatalities didn’t decline in 2015 — both 2014 and 2015 saw 31 traffic fatalities. Even more depressing, 2016 has come out of the gate running: we’ve already had 12 fatalities through March, compared to 9 in 2014 and 4 in 2015.
Hopefully, as the city continues to invest in safety infrastructure and other Vision Zero initiatives, we’ll actually see a reduction in traffic fatalities.
